Note: This section is meant to specifically address just why the Pilot Operated Relief Valve (PORV) lifted so quickly (~3 seconds) at the start of the Three Mile Island Unit 2 Industrial Accident on March 28, 1979.
Part 1
The Three Mile Island Unit 2 Pilot Operated Relief Valve (PORV)
Some basic review for folks not familiar with a B&W 177 Fuel Assembly Low Loop Pressurized Water Reactor (B&W 177 LL PWR).
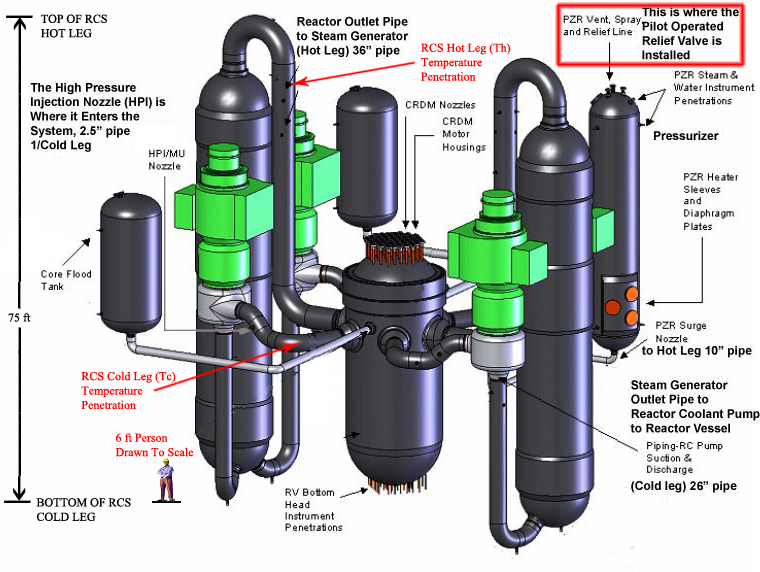
Figure 1. B&W 177 FA LL PWR
Figure 1 is a 3D drawing of the Nuclear Steam Supply System (NSSS) showing some system information and the relative scale size. It also shows the system location for the Temperature measuring penetrations (T-hot and T-cold) and the Pressurizer location where the PORV is installed. At 100% Reactor power the 4 Reactor Coolant pumps are pumping 2,250,000 lbm/min through the core (from NUREG/CR-4531). This is equivalent to about 27000 gpm.
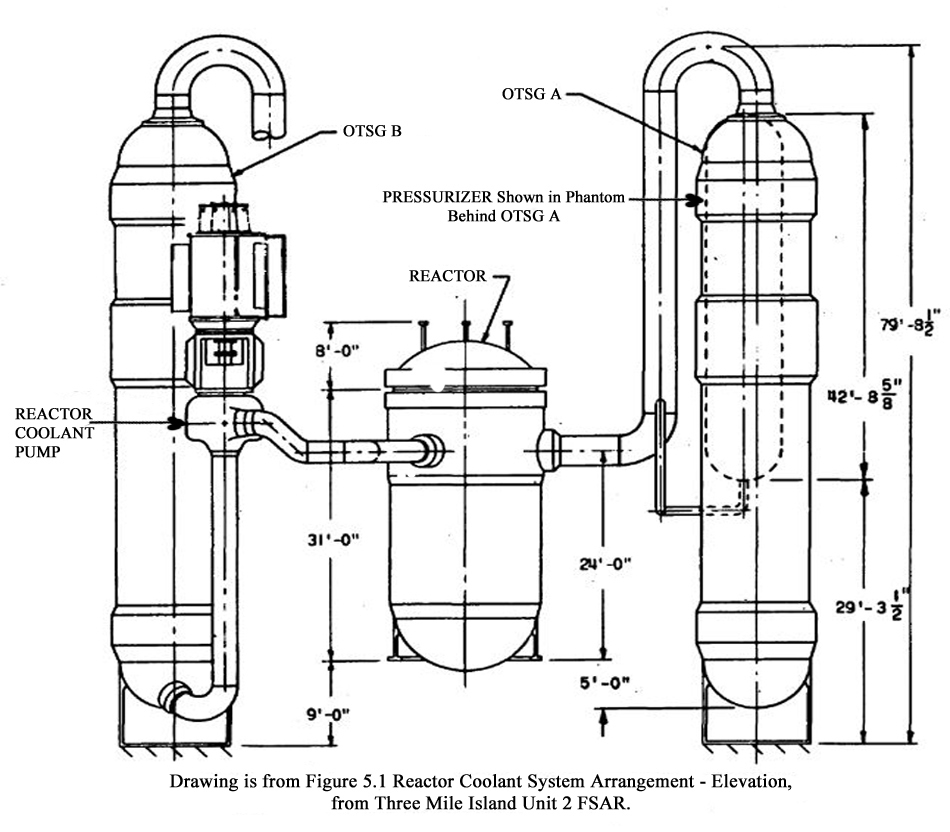
Figure 2. Plan View of B&W 177 LL PWR
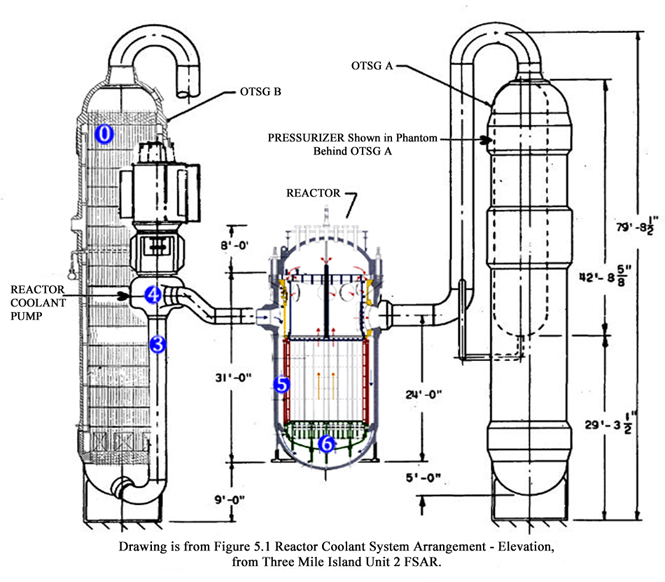
Figure 3. RPV and OTSG Inserted into Figure 2
(The below sequence of events is taken mostly from NSAC-1 and NUREG-0600 Reports on the TMI 2 Industrial Accident).
T=0 sec Both Main Feed Pumps (MFP) Trip and the Main Turbine Trips.
T=3 sec the PORV gets an open signal at 2255 PSI RCS Pressure (From NSAC-1 Report, NUREG-0600 Report says it’s 3-6 sec… actual time depends on recording equipment scan rate and processing time of data source). BUT IT’S QUICK.
T= 8 sec Reactor Trip on High Pressure at 2355 PSI.
T= ~40 sec Both OTSG Levels decrease to ~30” (The normal post-trip Low Level Limit).
T= 1.5 to 2 minutes the OTSG ‘Dry-out’ symptoms occur (10” indicated level OTSG water level, decreasing OTSG steam pressure, and loss of RCS delta-T which is T-hot minus T-cold).
Therefore “Loss of Secondary Heat Sink” is NOT what lifted the PORV at 3-6 sec!
Think the TMI2 Transient through in 1 sec intervals considering a 9.57 sec RCS Loop Transit Time starting at the time of MFP trip. (This Loop Transit Time is calculated by a TMI 1 RELAP5 run at 100% power).
When that warmer water leaves the OTSGs and reaches the T-cold instruments, it may cause a “control rods in” T-ave Error to the Control System.
When it reaches the Reactor Pressure Vessel (RPV) Downcomer region, the increased neutron leakage to the ex-core Power detectors may cause a “control rods in” Neutron Error to the Control System.
When it reaches the actual Rx core, the Negative Moderator T Coefficient will decrease Rx Power.
But… at 8 sec in the transient the Rx Trips on the High Pressure Trip, at 2355 PSI, and everything starts down.
It’s hard for me to even see the likelihood that an increase in T-hot is ‘observed’ on the instruments before the Rx Trip because the warmer water never gets to them before the Rx Trip.
This is NOT a “Classic” overheating event…. But the PORV has already lifted.
So what actually caused the PORV to lift so fast? It is not the reason given in all the Reports, i.e. Loss of Primary to Secondary Heat Transfer, or an RCS Overheating Event due to OTSG secondary side dry-out, etc.
Back to Figure 3.
Recall the Official Reports said that the PORV lifted 3-6 seconds after the TMI 2 Main Feed Pumps (MFP) tripped and Main Turbine tripped. Consider 5 different time intervals in seconds, shown on Figure 3 as blue numbered dots in Figure 3.
- Blue dot zero is “assigned” as time zero, for where a slug of RCS water is just at the top of the OTSG tube bundle, at the exact time of MFP Trip.
- Blue dot 3 is where that slug of water will be 3 seconds after the MFP Trip
- Blue dot 4 is where that slug of water will be 4 seconds after the MFP Trip
- Blue dot 5 is where that slug of water will be 5 seconds after the MFP Trip
- Blue dot 6 is where that slug of water will be 6 seconds after the MFP Trip
The 3-6 seconds cover potential time increments for the PORV lift.
The 3 second mark is in the RCS Cold Leg at the RCP suction. The 4 second mark is in the RCP. The 5 second mark is in the Reactor Pressure Vessel Downcomer region. The 6 second mark is in the Reactor Pressure Vessel Lower Grid region.
(These distances the slug of RCS water traveled in these time increments are from data from a RELAP5 run, done for TMI 1 and available to me).
Note also that NUREG-0600 says that the Reactor Coolant Drain Tank pressure, where the PORV discharges, started to increase at 3 seconds (recorded on the reactimeter) after the MFPs tripped, so it is likely that the PORV lift time is closest to the 3 second mark.
So what did cause the PORV to lift so quickly? It was something that happened inside the OTSG, and the explanation is in Part 2 below.
Part 2
Why Is A Babcock and Wilcox (B&W) Pressurized Water Reactor (PWR) Reactor Coolant System (RCS) Pressure So Sensitive To Decreasing Main Feedwater (MFW) Flow?
(It Probably Isn’t Due to What You Have Been Taught or Heard)
Background
The longer-term sensitivity of the B&W PWR RCS pressure to decreases in MFW flow is generally well understood by B&W PWR Operators.
The uniqueness of the B&W PWR design is that it uses Once Through Steam Generators (OTSG) while other PWRs use U-Tube Steam Generators.
The key to understanding the short-term RCS pressure sensitivity to decreasing MFW flow is understanding the specific Thermal-Hydraulic response of the OTSG to changing MFW flow.
Background
Review of some of the generic training material available for OTSGs indicates some of this material is just flat out wrong.
Other material has been too simplified to the point it is misleading.
The result of all this is that while the general sensitivity of a B&W PWR RCS pressure to decreasing MFW flow is understood, the specific reason for the strong rapid short-term sensitivity is not.
Review
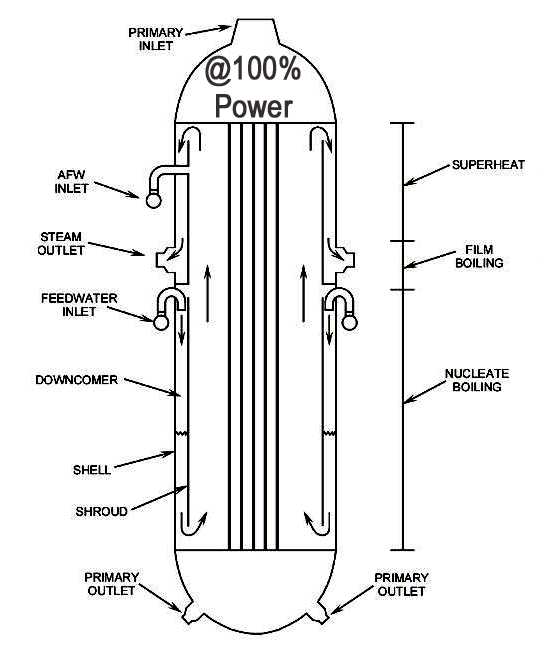
Downcomer - Direct Contact Sensible Heat addition by steam heating of ~450F FW to T-sat @OTSG steam P.
Superheat - ~30% of tube length. Sensible Heat addition to initial dry saturated steam heating to Superheated ~590F at region exit.
Film Boiling - ~10% of tube length. Final 10% of Latent Heat of Vaporization added. 0% Moisture Content at region exit.
Nucleate Boiling - ~60% of tube length. Latent Heat of Vaporization added at constant T. Bulk fluid from 100% Moisture Content to ~10% Moisture Content at region exit. ~90% of the RCS to Secondary side heat transfer in this region.
Review
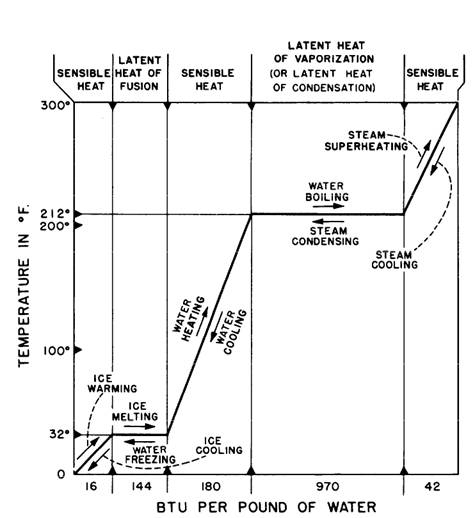 T-h Diagram at Atmospheric Pressure
Latent Heat – Heat addition causing change of ‘Phase’ at constant T. (e.g. liquid to vapor)
Sensible Heat – Heat addition causing a change in T with no change of ‘Phase.’
The OTSG Downcomer and Superheat Regions add Sensible Heat to the FW/Steam.
The OTSG Nucleate and Film Boiling Regions add Latent Heat.
The values of BTU/lb of water show why the size of the Nucleate Boiling Region is so effective in removing heat (Cooling by removing BTUs) from the RCS.
Review
To change load at high power, the OTSG relies on a change in the proportion of Nucleate Boiling area to Superheat area, and a consequent change in the overall OTSG heat transfer coefficient, instead of a change in primary-to-secondary temperature differential. Heat transfer in the OTSG can be described by the following equation:
Q = UA∆T
Where:
Q = heat transfer rate
U = overall coefficient of heat transfer
A = area of heat transfer
∆T= temperature difference (Tave - Tsat)
The key word here is ‘Overall’ heat transfer coefficient. This is accurate when considering the OTSG as one large heat transfer device for RCS to Secondary heat transfer.
But In Reality…
What is really going on inside an OTSG is heat transfer in three different size heat transfer areas with three very different heat transfer coefficients, and three very different (and continuously changing) delta Ts.
Therefore:
Q = mA(Nucleate Boiling Area)(T-source – T-sink)
plus
mA(Film Boiling Area)(T-source – T-sink)
plus
mA(Superheat Area)(T-source – T-sink)
From the previous T-h diagram we saw the heat transfer ability (~m) was vastly better in the Nucleate Boiling area than in the Superheat area.
And the ‘m’ in the Film Boiling area ain’t so good, because of the insulating effect of the steam bubble blanketing of the tubes on the Secondary side.
And very important, the delta T (T-source – T-sink) for heat transfer is constantly changing (RCS T-source decreasing) as the RCS flows downward through the OTSG tubes transferring heat to T-sink.
Probably Seen in Training
Key Point
Consider just the Nucleate Boiling Region Ht-X
Where Q = mA(Nucleate Boiling Area)(T-source – T-sink)
In this region T-source is the RCS Fluid T at any particular point where a slug of RCS water is passing through a (fixed) size Area
As this slug passes lower into the region, into another fixed (same) size Area, the slug T is lower because it gave up heat to the T-sink on the Secondary Side
The T-sink side T is fixed (constant) because it is the T-sat for the Secondary Side P at that location in the OTSG
Considering the above initial equation, with a constant m, and a constant A (by assumption), the Delta T for Ht-X has to be constantly decreasing
Thus, since the Delta-T for Ht-X (T-source – T-sink) is constantly decreasing as the slug continues down through the OTSG, less Q is transferred in each lower equal A
So it follows, the RCS Fluid T drop line vs. Tube height can’t be a straight line
It must have a decreasing slope as that slug moves lower in the OTSG Nucleate Boiling Region.
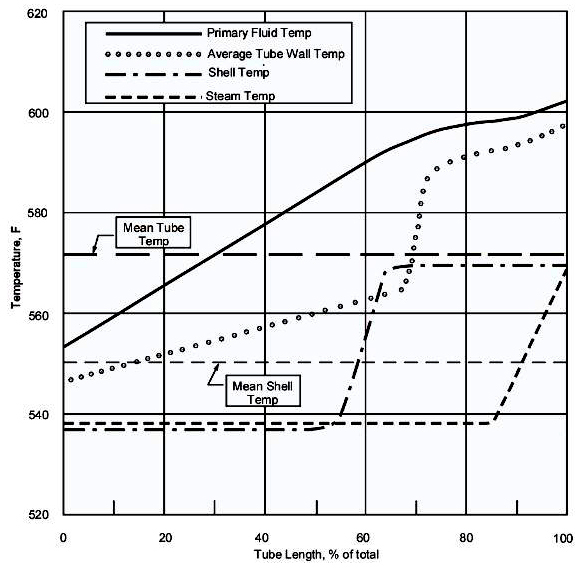
Generic B&W OTSG Training Figure
Primary Fluid T line can’t be right!
Shown as straight line in 0-60% Tube Length (Nucleate Boiling Region).
Ht-X delta T is constantly decreasing in this region.
Ht-X delta T = Constantly Decreasing RCS T minus Constant Sec Side T.
Therefore the line must be a curve, with constantly decreasing slope from 60% to 0%.
Curve slope must have a more obvious ‘knee’, where Ht-X changes from (poor) Sensible Heat addition to (good) Latent Heat addition.
How’s this look…?
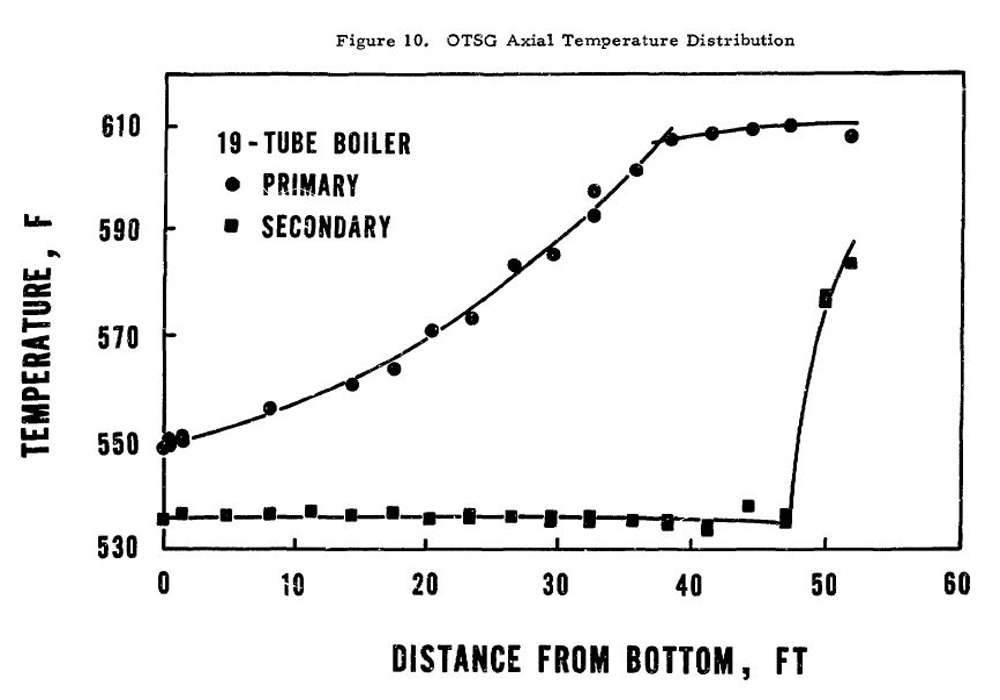
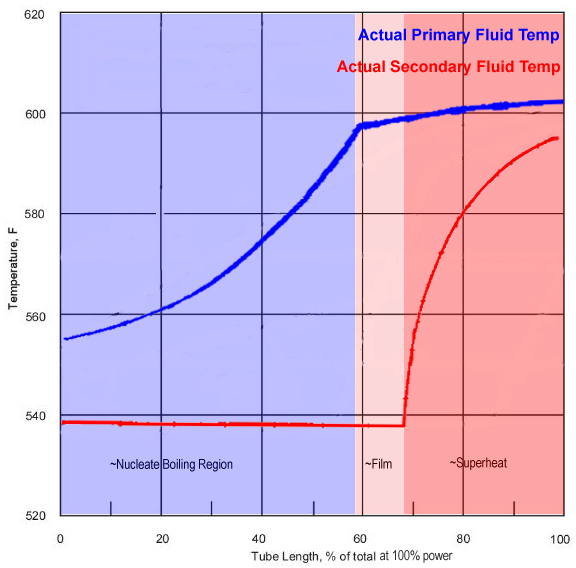
Actual measured Ts from B&W 19-Tube OTSG Test.
Tube length in this scale model test is same as full size OTSG.
Therefore same Ht-X principles must apply to Ht-X Regions of full size OTSG.
Note in Nucleate Boiling Region a constantly decreasing slope.
Note at transition from Sensible Heat addition in Superheat Region to Latent Heat addition in Film/Nucleate Boiling Region an obvious ‘knee.’
Re-plot 19-Tube Data on Generic Curve
.jpg)
Clean the Curve up…
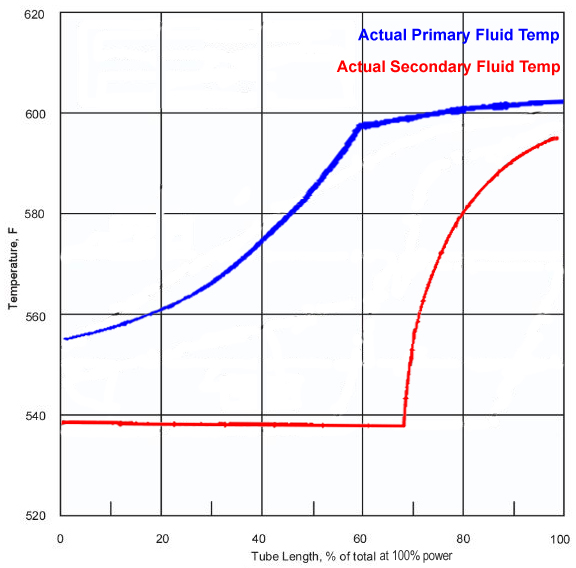
Add Heat Transfer Regions
So What Happens Inside the OTSG If Something Bumps MFW Flow Down At High Power?
Obviously the OTSG Secondary Level will start to decrease.
Meaning the size (area) of the Nucleate Boiling region will decrease and the size of the Superheat region will increase.
How does this change the RCS T response in the regions of changing areas?
A Question…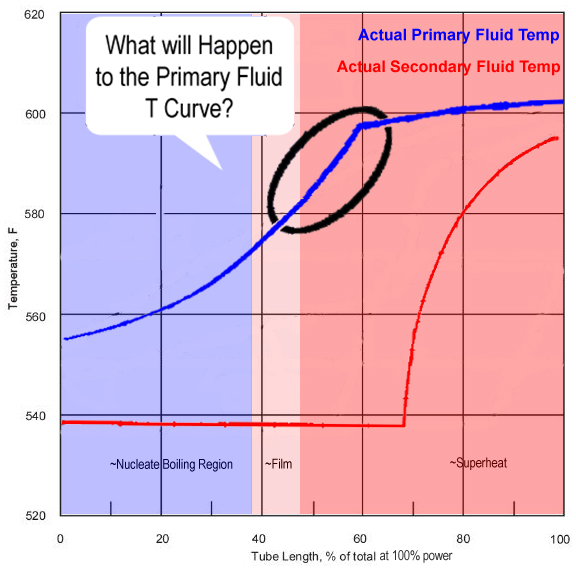
The RCS Water flowing down the tubes at this point will be in the Superheat Region longer, and will maintain the T drop profile slope shown at about the 60% tube length.
It will maintain that profile until it hits the lowered Nucleate Boiling Region level at the new Nucleate Boiling region (arbitrarily ~40%).
In other words, less heat will be removed from the RCS water volume passing through this ~20% of tube length.
Like This…
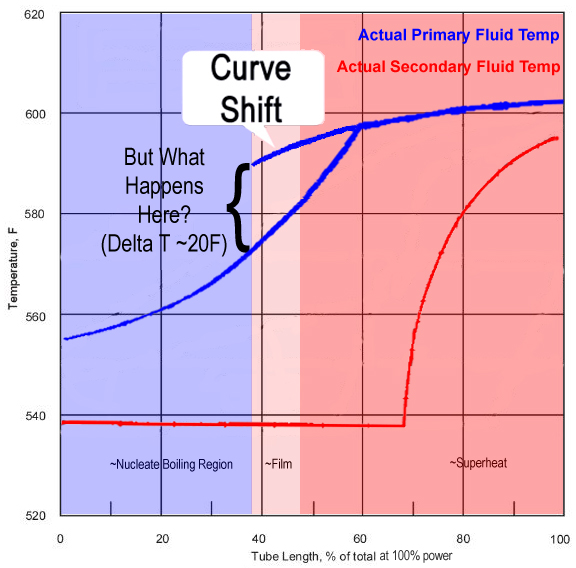
The T of the RCS water exiting the old Superheat Region at ~60% will maintain a T drop consistent with the slope of the initial T drop curve.
Until it hits the level of the new lower Nucleate Boiling Region.
But then we have to “connect the dots” of the Actual Primary Fluid T curve....
And This…
Note the upward shift in RCS T at the OTSG exit
This T is AKA Tc
It happens as fast as the size of the Ht-X Regions change
Way less time than ‘Loop Transport Time’
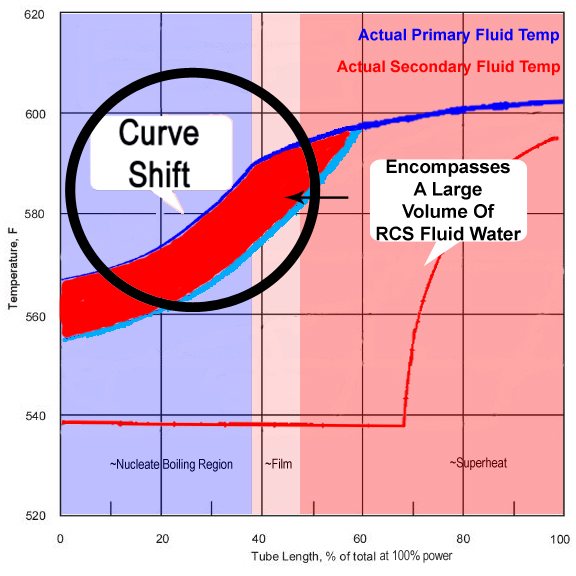
- This T increase affects all RCS Fluid passing through the new Ht-X regions of the OTSG Well before it ever exits the OTSG
- Well before it is seen on the Tc measuring instrument
- It causes an increase in the bulk RCS Fluid T-ave
- Which results in a Pressurizer L in-surge
- Which causes an RCS P increase
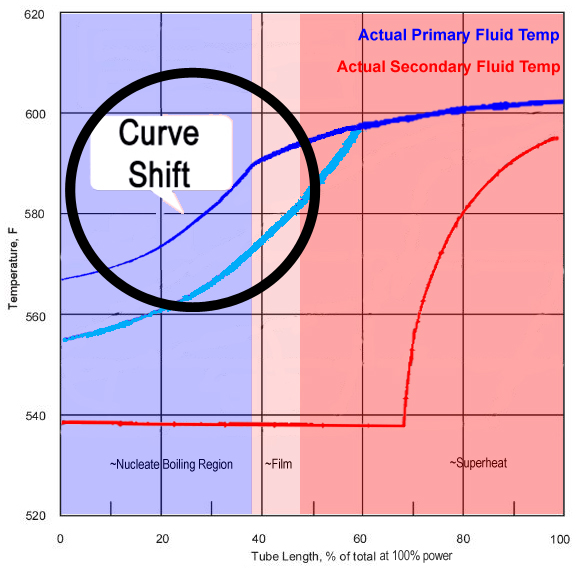
So What Does It Mean Where The ‘Rubber Hits The Road’…?
.jpg)
Food For Thought…
We’ve seen by Ht-X principles this decreasing MFW Flow, changing the OTSG Ht-X Region size, must cause an upward shift (T increasing) to the RCS T profile of the water flowing down through the tubes
This changing T is NOT A SMALL VOLUME OF WATER! There are several thousand tubes in an OTSG
This changing T happens as fast as the RCS Fluid passes through the Ht-X Regions
Well before the water exits the OTSG and reaches the Tc measuring (indication) instruments (in less than Loop Transport Time)
Decreasing MFW Flow in an OTSG is a very powerful influence on the actual RCS T-ave
Food For Thought (continued)…
In a ‘typical’ PWR, the ‘Cold Side’ RCS Volume is twice the size of the ‘Hot Side’ volume (may not be true in a B&W Raised Loop Design)
Thus a T change in Tc has twice the effect of an equal T change in Th, considering the net expansion/contraction of the total RCS water volume
Comparing PWRs in general for equivalent Thermal Power ratings, a B&W OTSG has very little water (heat sink) on the Secondary Side at 100% power
B&W Sec Side @100% has ~57K lbs water in 1 of 2 OTSGs
W Sec Side @100% has ~167K lbs water in 1 of 4 SGs
CE sec side @100% has ~280K lbs water in 1 of 2 SGs
In a B&W plant @100% the RCS is transferring ~1380MWt into a water volume equivalent to only ~6900 gallon tank (if it was at atmospheric conditions)
If it was possible to maintain power at 100%, stopping all MFW Flow would empty an OTSG Secondary Side water in ~3.5 seconds
Conclusions…
Since Q = UA(T-ave minus T-sat) and almost all that 1380MWt is being transferred in the u(A of nucleate boiling region) of an OTSG…
When MFW Flow decreases and that Area immediately decreases, Mother Nature says stop removing heat in the lost Area region and Tc screams up with a vengeance immediately affecting T-ave.
(In the Nucleate Boiling Region Q = m(A of NB region)(T RCS minus T-sat)
This transient is intuitively thought of as an Overheating transient…
But inside the OTSG it is an Under Cooling transient causing a net increase in RCS T-ave (by increasing Tc) in less time than RCS Loop Transport Time
The thermal expansion of the RCS water due to the increasing Tc in-surges to the Pressurizer, thus increasing RCS Pressure
Consider This B&W LL 177 FA PWR Info…
(Mostly from NUREG/CR-4531, February 1987)
- Ave system total volume 11073 ft-cu
- Volume of RCS inside each OTSG tubes 1450 ft-cu
- OTSG tube length (tube sheet to tube sheet) 52.1 ft
- Therefore ~27.8 ft-cu/ft OTSG tube
- Estimated (calculated) Loop Transport Time 11.3 seconds
Considering a MFW Transient Sequence of Events (SOE) that causes a severe reduction in MFW flow (like TMI2)…
(Mostly from NSAC-1 and NUREG-0600)T=0 sec Both MFPs Trip and Main Turbine Trip
T=3 sec PORV Opens @2255 PSI RCS P (From NSAC-1, NUREG-0600 says ~3-6 sec… actual time depends on scan rate and processing of data source). BUT IT’S PDQ.T= 8 sec Reactor Trip on HP @2355 PSI
T= ~40 sec Both OTSG Levels decrease to ~30” (Normal post-trip Low Level Limit)
T= 1.5 to 2 min OTSG ‘Dry-out’ symptoms (10” indicated level, decreasing steam pressure, loss of RCS delta-T)
Therefore “Loss of Secondary Heat Sink” is NOT what lifted the PORV at ~3-6 sec!
B&W LL 177 FA PWR Info (cont.)
So what caused the PORV to lift so quickly?
It’s the Pressurizer In-Surge due to water expansion inside the OTSG from this curve shift upward.
Think the TMI2 Transient through in 1 sec intervals considering an 11.3 sec Loop Transport Time
When that warmer water leaves the OTSGs and reaches the Tc instruments it may cause a “rods in” T-ave error.
When it reaches the RPV Downcomer region, the increased n leakage to the ex-core Power detectors may cause a “rods in” Neutron error.
When it reaches the actual core, the Neg Mod T Coeff will decrease Rx Power
But… at 8 sec the Rx Trips on H.P. and everything starts down.
It’s hard for me to even see a likelihood an increase in Th is ‘observed’ on the instruments before the Rx Trip.
This is NOT a “Classic” overheating event…. But the PORV has already lifted.
Corroboration
In 2019 during the TMI1 Simulator benchmarking after a Thermal-Hydraulic Model upgrade, the TMI2 accident was run.
- The TMI1 Simulator OTSG model contains 24 calculation nodes for the Primary and Secondary sides of the OTSG Tube bundle region.
- The Simulator was first stabilized for 30 min recording data at 0.25 sec intervals
- Both MFPs were then tripped
- The PORV lifted at 10.5 sec after the MFP trip
- The Reactor tripped at 12 sec after the MFP trip
- The Primary side RCS water T of the nodes from the Simulator run were plotted on the previously discussed curve
Corroboration (Continued)
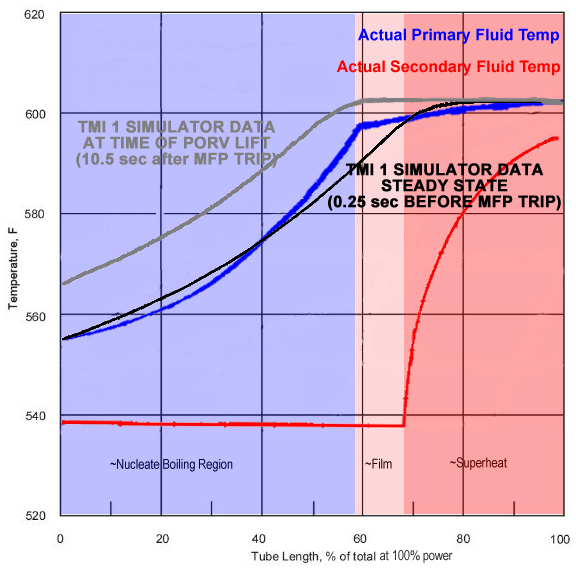
You can see the Primary side T profile, before the MFP Trip, closely agrees with the Primary side T profile of the previously discussed B&W 19-Tube model Primary T profile.
And the Primary side T profile, after the MFP trip at the time of PORV lift, agrees with the previously postulated up-shift of the Primary side T profile due to decreasing OTSG Ht-X Regions from the MFP Trip.
Using B&W LL 177 FA PWR Info and the TMI1 Simulator Data
The Steady State OTSG Operate Range Level at the time of MFP Trip was 71.3%
The OTSG Operate Range Level at the time of PORV lift (10.5 sec later) was 59.4% (this information is just given here to show the OTSG was level dropping)
What is an “eyeball guess-timate” of the volume of a potential in-surge due to this change in OTSG Ht-X region level drop at 100% power?
- An OTSG tube bundle total volume is 1450 ft-cu
- At the TMI1 Simulator the Steady State value average T of the water inside the OTSG tubes was 581.6F
- The average water Density at those conditions is 43.79 lb/ft-cu
- This represents (43.79 lb/ft-cu X 1450 ft-cu) = 63495.5 lb of water inside the OTSG tube bundle Primary side
- At the time of PORV lift the average T value of water inside the OTSG tubes was 588.6F, with a Density of 43.27 lb/ft-cu
- So the original 63495.5 lb of water in the OTSG tubes would expand to (63495.5 lb/43.27 lb/ft-cu) = 1467.4 ft-cu
- Or (1467.4 ft-cu – 1450 ft-cu) = 17.4 ft-cu expansion
- Times 2 OTSGs = a potential 34.8 ft-cu in-surge into the Pressurizer
- I won’t tell you the corresponding PRZR Level increase because it’s on the quiz (wink, wink...)
- If treated like an Ideal Gas (approximation with a very rapid steam bubble compression), what is the potential RCS Pressure response….?
P1 X V1 = P2 X V2 or P2 = (P1 X V1)/V2
2170 PSIA X 700 ft-cu/665.2 ft-cu = ~2284 PSIA… enough to lift the PORV
Disclaimer
- This presentation is meant to visually illustrate why a B&W PWR RCS Pressure is very sensitive to decreasing MFW Flow
- The Temperature change values in this presentation are for illustration purposes only
- The Temperature change values should not be interpreted as actual plant specific values
- They are based on principles of changing Ht-X Region conditions in an OTSG
- They are correct in the direction of change, but not in absolute value
© 2017 BY MICHAEL J DERIVAN